Empowering the Frontline
From complex store data to clear and confident actions.

🎯 Overview
Flow is a B2B retail platform in Japan that turns in-store data — from POS, sensors, and cameras — into insights. But dashboards alone weren’t enough.
I focused on a bigger goal: helping non-technical store staff feel confident acting on data, not just watching it.
Constraints created focus: we saw an opportunity to simplify data literacy, support new staff, and use LLMs to translate raw metrics into clear, human-language guidance.
Role
Lead UX Designer (Solo)
Research Strategy GamificationMarch 2024–Current
🔍 The Challenge
Japan’s retail sector is under pressure — aging demographics, ecommerce competition, and labor shortages. Physical stores must adapt, but many struggle with digital tools.
Flow’s platform was underused and perceived as “just a dashboard.” We needed to shift it into a day-to-day decision-support tool for busy frontline staff.
- Low data literacy → users overwhelmed by raw metrics
- High turnover → poor knowledge transfer
- HQ and store teams misaligned
- No clear guidance on “what to do” with the data
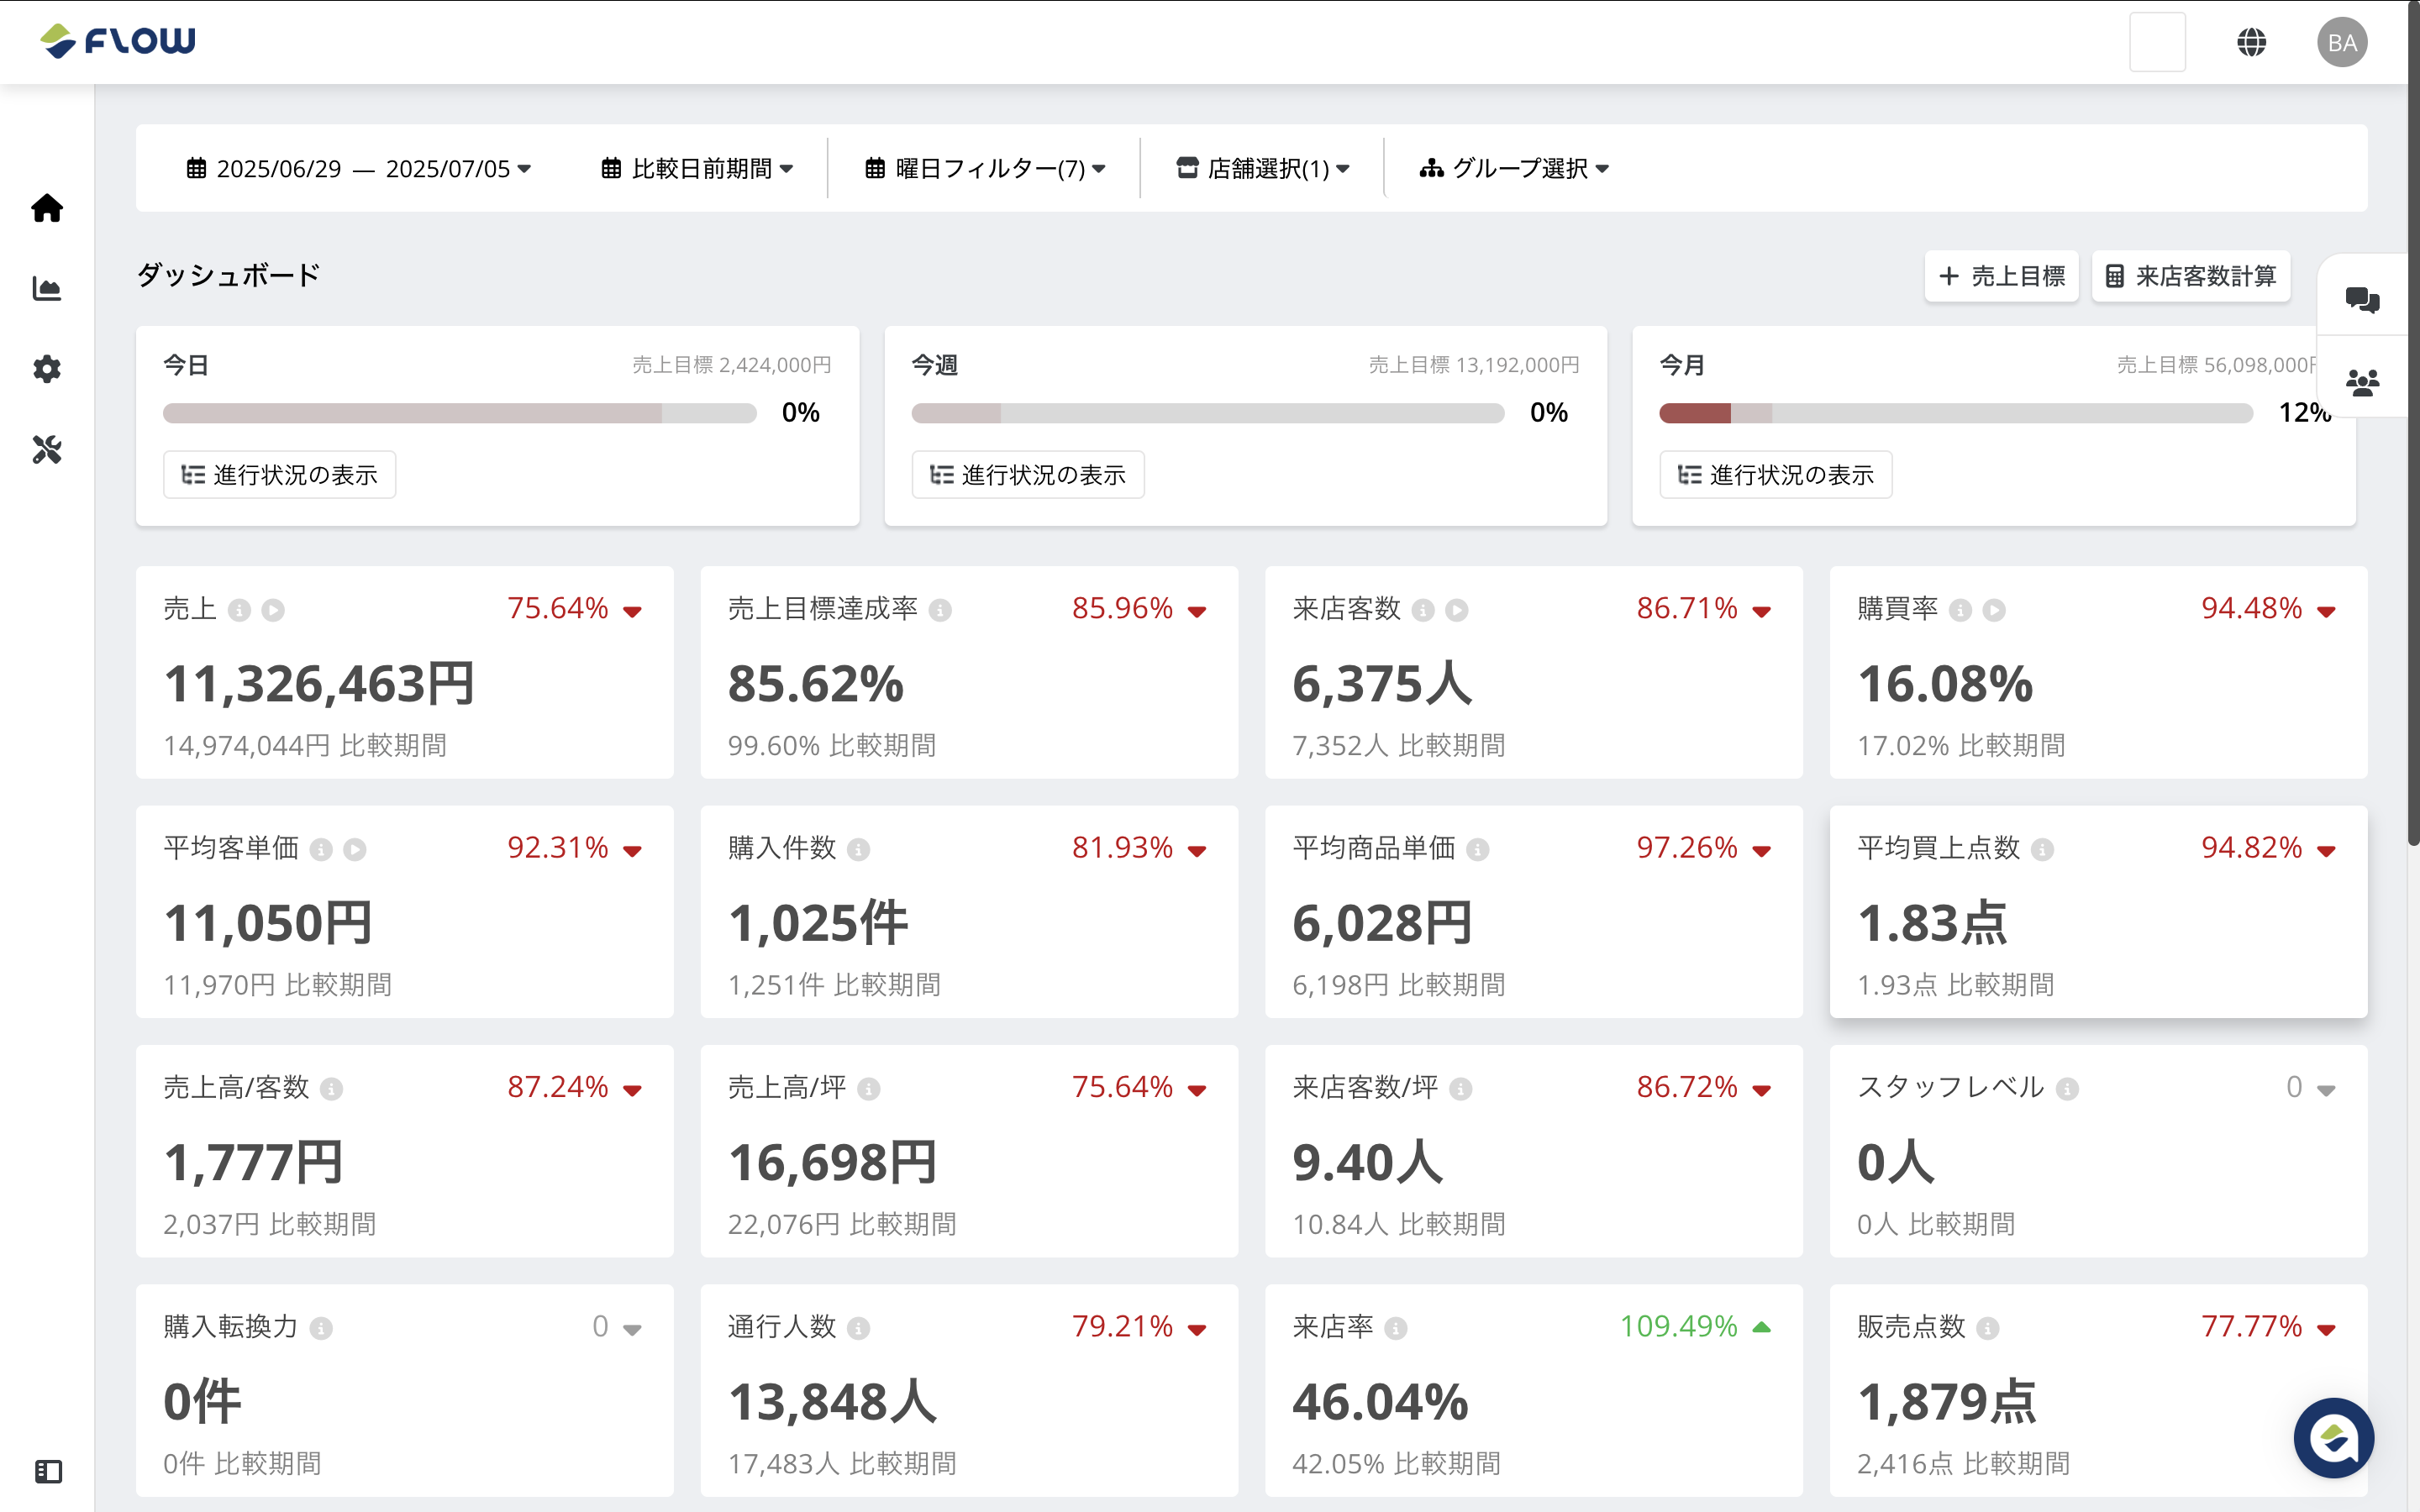
🕰️ Before: Legacy Dashboard Experience
The original dashboard overwhelmed users with difficult to understand metrics, lacked clear next steps, and presented the same UI across diverse store contexts — creating confusion and low engagement.
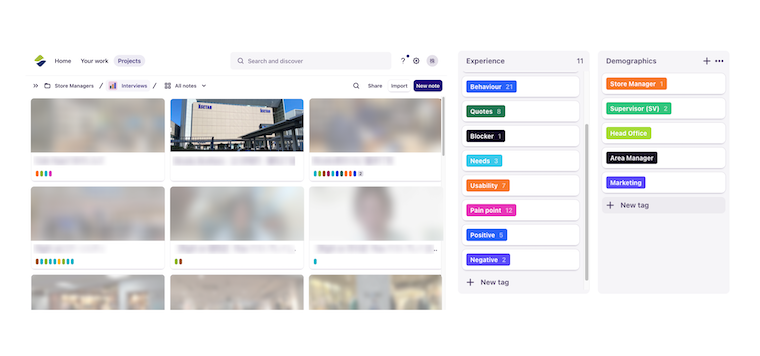
🔎 Discovery & Design Process
- Audited the legacy platform UX
- Ran 25+ interviews across 6 retail brands
- Synthesized key themes: tech fatigue, fragmented knowledge, low data confidence
- Mapped common workflows — from shift planning to store performance reviews
- Reframed data presentation using a simple structure: What’s happening? → So what? → Now what?
🧩 From Dashboards to Action
Rather than build more charts, I turned raw store data — both qualitative and quantitative — into contextual, scannable suggestions staff could actually use on the floor.
Behind the scenes, select inputs (e.g. traffic patterns, sales drops, staff observations) are fed into a large language model (LLM) that generates relevant, natural-language prompts. I treated prompt engineering as part of the UX — refining tone, clarity, and relevance through iterative tuning informed by staff feedback.
The resulting guidance appears in card format — grouped under categories like: Ideas, Improvement, and Completed. They’re lightweight, symbolic, and a little bit gamified — designed to reduce friction and encourage follow-through.
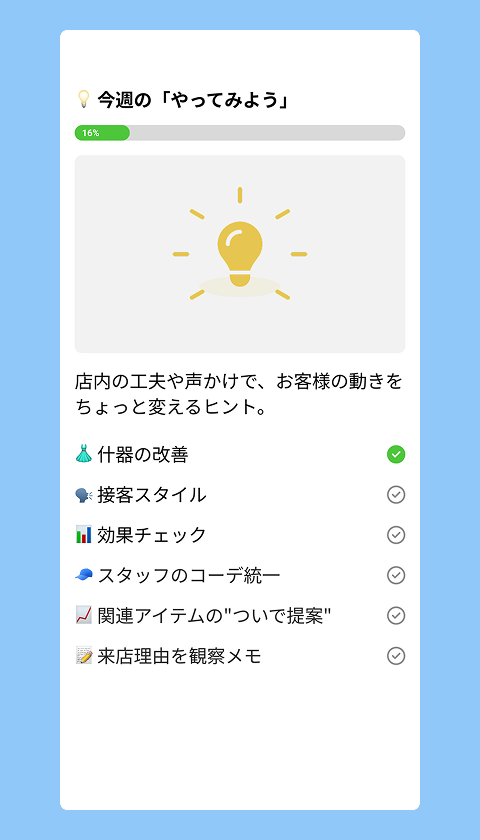
Store Task List
A list of simple, data-backed actions — with checkmarks and a progress bar to help staff stay on track.
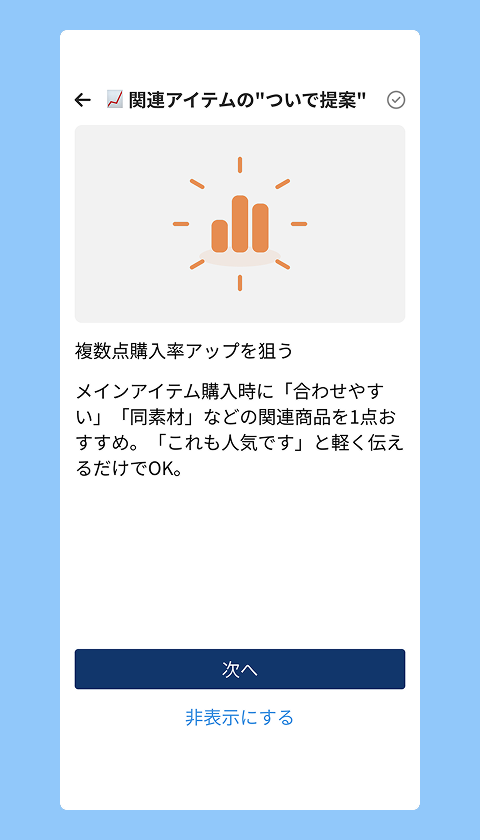
One Card at a Time
Each card offers a clear task, with context and reasoning. Users can complete, skip, or browse at their own pace.
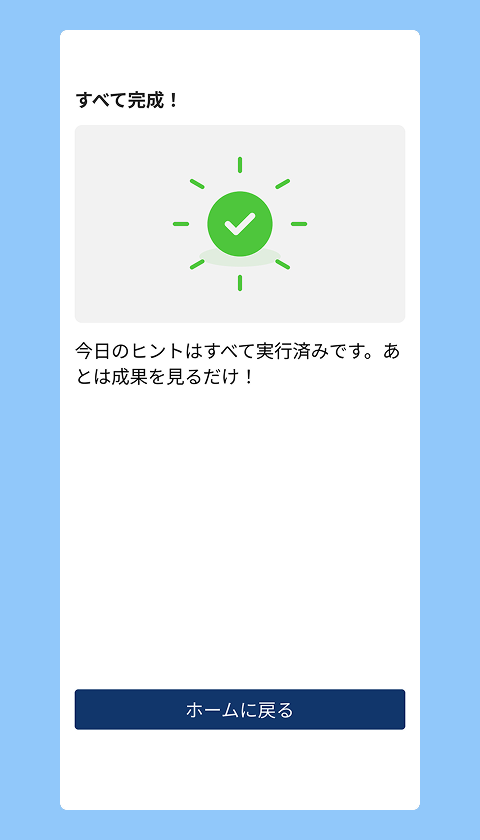
Progress Reinforced
A sense of completion matters. The wrap-up view helps reinforce habit-building and daily return use.
👀 Early Impact & Signals
- Helped shift product perception from passive dashboard → active support tool
- Retired the native iOS app:
- Freed up development resources
- Reduced friction — web app available on any device, instantly
- Faster iteration with a single codebase
- LLM-driven natural language suggestions became a key enabler — turning complex data into guidance staff could act on